
See your international P&L in real time.
Sales, ROAS, CAC, LTV, and unit economics — by country, by channel, by cohort. Every number you need to scale international, in one dashboard.















The numbers that actually move international revenue.
Most cross-border platforms hand you transactions. We hand you the data that tells you where to invest, where to cut, and where to grow next.
Blended ROAS and net AOV.
Performance by sales channel and region. See exactly how your ad spend is converting in each market — DTC, Amazon, TikTok Shop — without pulling five separate reports.
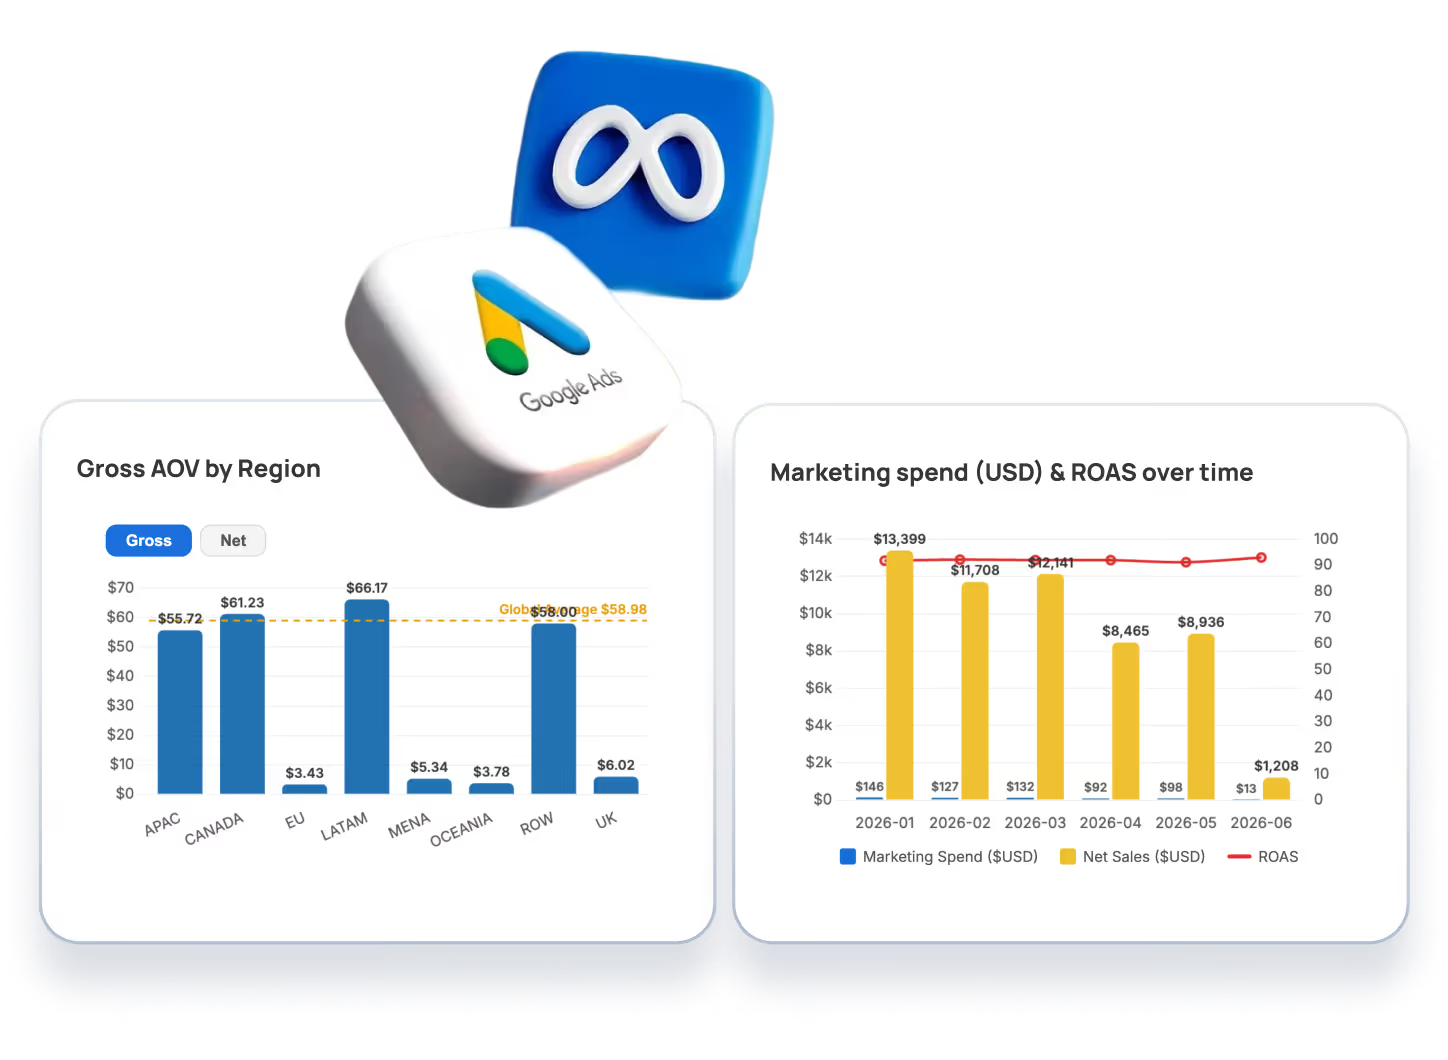
CAC, LTV-CAC, and payback periods.
Track unit economics by customer cohort and region. Know when each market becomes profitable, not just whether it's growing.
.avif)
Repeat order & retention trends.
See how customers in each region behave after their first purchase. Time to repeat order. Retention curves. The retention story that's hidden in your aggregate data.
.avif)
Country-level unit economics.
The clean, market-by-market view of what each customer is actually worth — and what each market is actually costing you to acquire.
.avif)
How DRMTLGY used the data
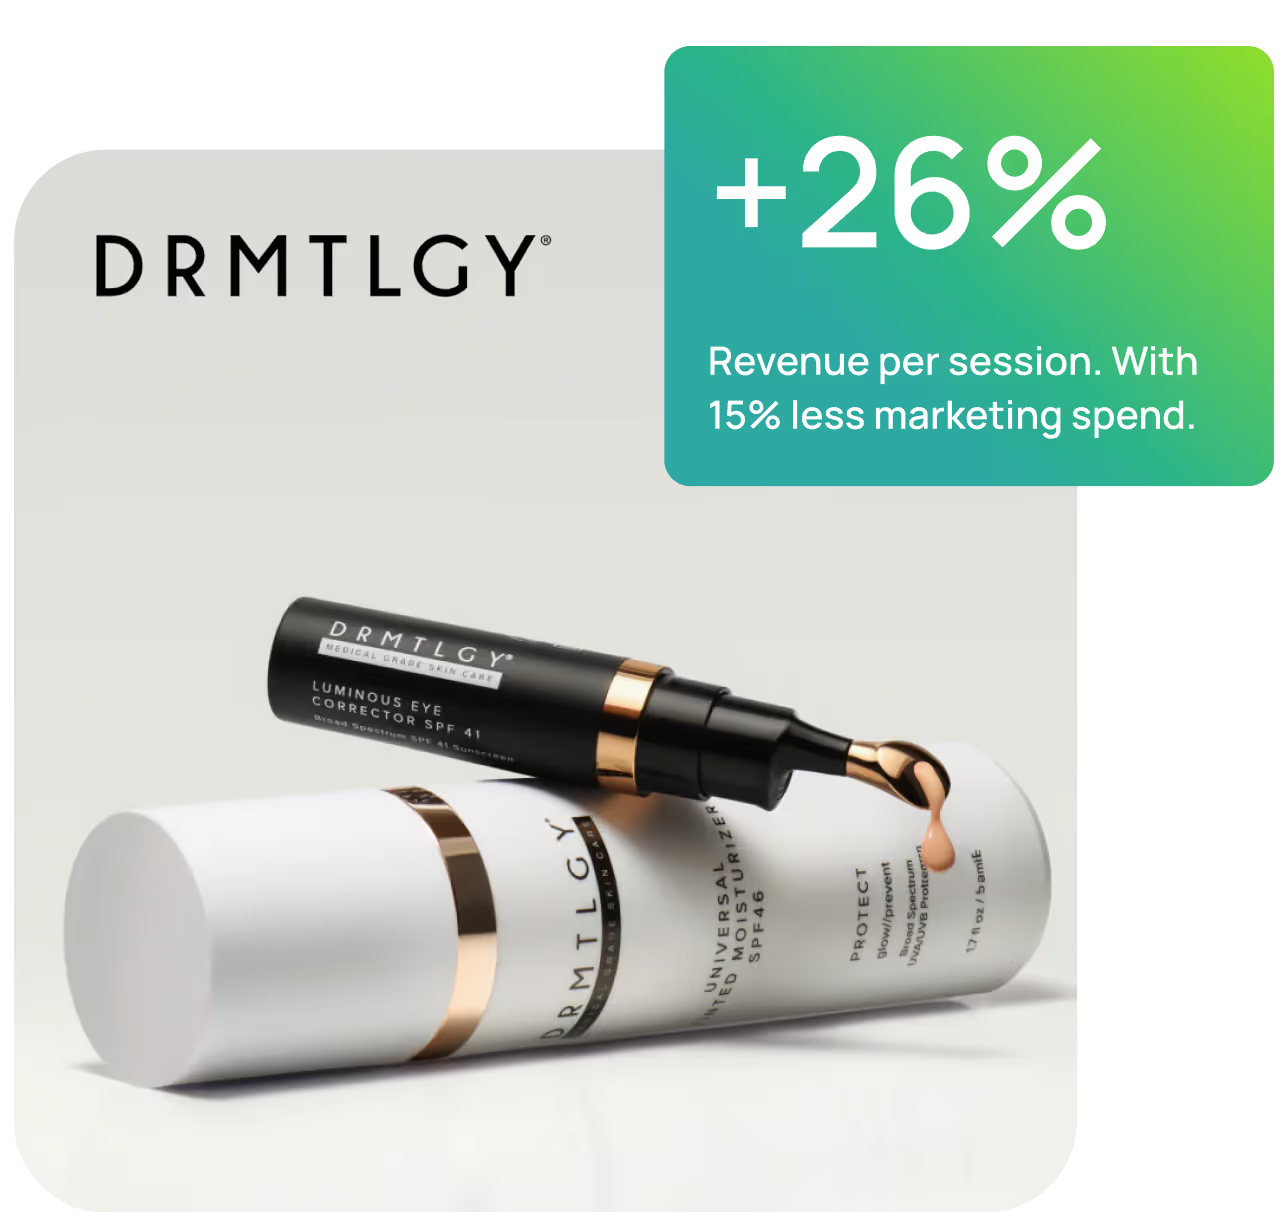
DRMTLGY had been investing across multiple international markets — without a clear picture of which ones were actually paying back. Singapore was outperforming across nearly every metric. It quickly became their fourth-largest market by revenue.
Revenue per session went up 26%. Marketing spend went down 15%. Both at the same time.
.svg)
The platform for international growth.
See what's driving international profitability, then grow faster with conversion optimization and a dedicated growth team.
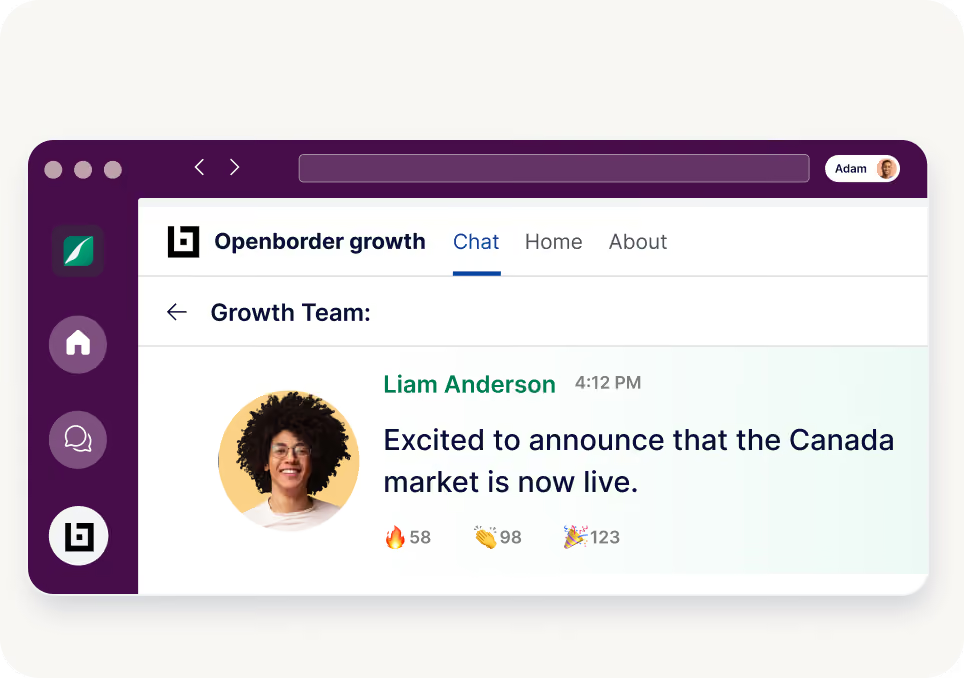
International growth team
A team alongside yours — using the same data to help decide markets, and scale revenue.
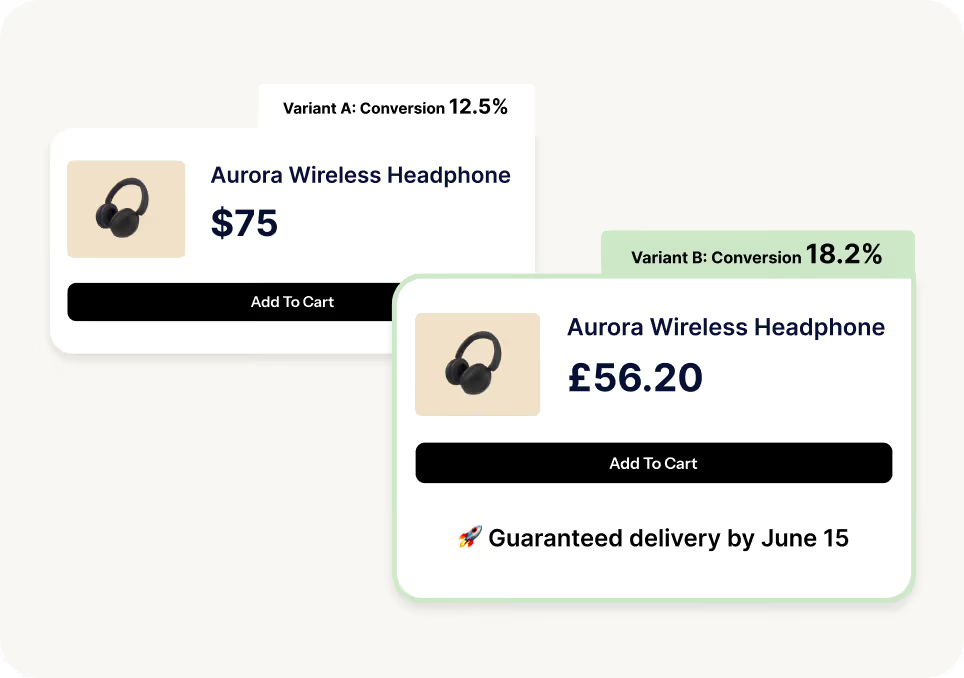
Conversion rate optimization
Localized checkout, delivery promise, smart pricing, and A/B testing — to lift conversion across every market.
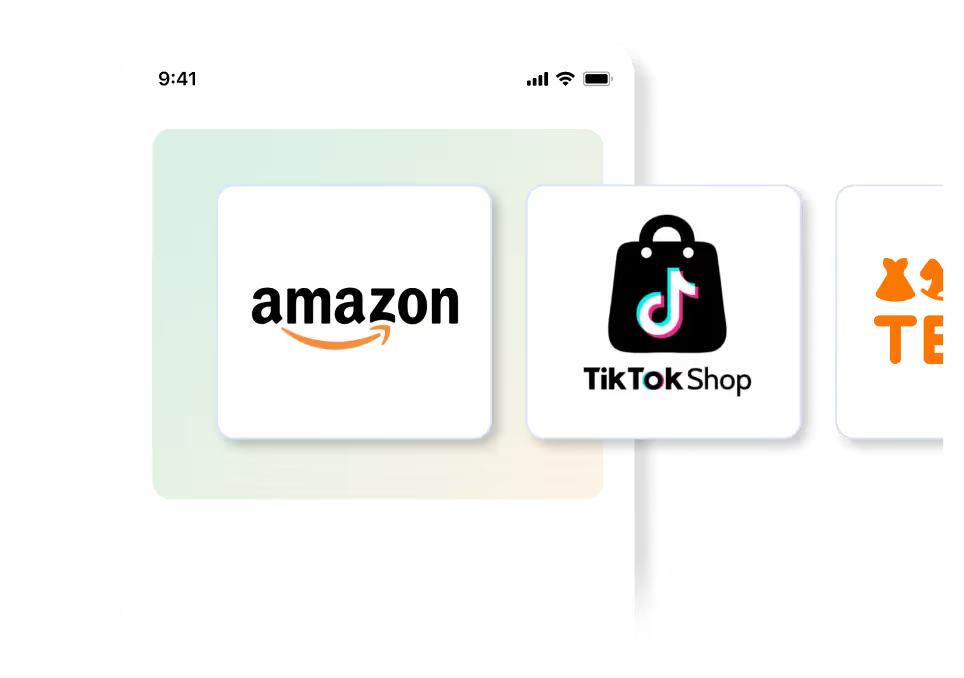
International marketplaces
Amazon FBA and TikTok Shop UK & US — with channel-level data fed directly into the dashboard.
Frequently asked questions

What data sources does the dashboard pull from?
How is this different from my Shopify dashboard?
Can I see channel-level performance for marketplaces?
How real-time is the data?
Does this replace my analytics or BI tools?
Stop flying blind on international growth.
We'll set you up in 2 weeks. And give you the visibility to scale international the way it should be — with data, not guesses.
Request a demo

- Real-time P&L
- Every channel
- Every market
